How to Tell if Your Site's Traffic Took a Hit from Google's Mobile-Friendly Update

 Google's much anticipated mobile-friendly algorithm didn't quite have the impact that was expected.
Google's John Mueller said that although the algorithm did affect many search queries, most marketing teams and SEOs failed to see much of a difference in their website's search traffic.
Mueller attributes the lackluster roll-out to the fact that most sites were either already mobile-friendly or that traffic was changed on a page-by-page basis (not across the entire website like a Panda update) and went unnoticed.
Below, we walk through how to use your Search Console (Webmaster Tools) account to investigate your website's mobile traffic spikes and dips as result of the mobile-friendly update (at both the page level and query level).

How to Set Up A Mobile Search Analytics Report
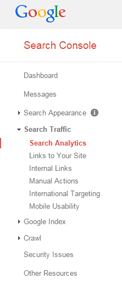
Within Search Console, navigate to Search Analytics beneath the Search Traffic menu item in the left sidebar.
Once there, you will need to set parameters in order to create a report will only display mobile analytics.
We will start by setting up a report that displays mobile traffic comparisons on a page-by-page basis.
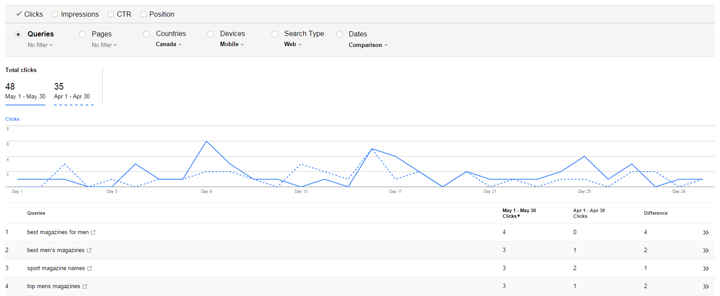
Within the grey bar:
1. Check off "Clicks" in the top left;
2. Select the "Pages" radio button;
3. Filter the Countries that you would like to analyze traffic from;
4. Filter Devices to only show traffic from Mobile;
5. Filter Search Type to Web and
6. Set up a custom comparison for Dates (the first two weeks of April vs. the first two weeks of May is a good comparison for seeing the initial impact of the mobile-friendly update).
Once all of these parameters are set, you will be able to see a graph that shows whether your site's mobile traffic went up, down or remained the same pre- and post-algorithm update.

When "Pages" is selected, you will be able to see the URLs that have lost or gained traffic by the amount of clicks received in both time periods. The numbers under the Difference column display how many clicks, more or less, took place between the two time periods for each URL.
You can re-order URLs to display in order from most traffic gained or most traffic lost by hitting the "Difference" column header.
By clicking on Queries, the report returned will show you how many clicks a specific search query resulted in between the two time periods. You can also re-order search queries by hitting Difference.
To see which pages a search query led to, click on a search query within the chart.

If you notice a significant rise or drop in a page's or search query's click-through-rate between the two time periods, select Impressions in the top left of the grey bar (beside Clicks). If the total search volume for a specific keyword stayed the same in comparison to your click-through-rate, it's likely that the mobile-friendly algorithm update impacted a page's mobile SERP visibility.


