What is your developer-dependent CMS actually costing you? Calculate your costs and get a full report


Going Live
Improving and Monitoring Lighthouse Scores
What moves a Lighthouse score on an Agility-powered site, biggest wins first, and how to set up a daily Lighthouse check with floors and alerts so scores don't drift after launch.
What moves a Lighthouse score on an Agility-powered site, in the order it usually matters, and how to set up a daily check so the score doesn't drift after launch.
A site can score 100 on desktop and under 50 on mobile with the same code. Lighthouse's mobile profile simulates a mid-range phone on a slow connection, and on that phone everything that runs during page load counts: your code, and every script your tag manager adds.
This guide covers two things:
- Improving the score: the changes that moved ours, biggest first.
- Keeping it: a scheduled Lighthouse run that fails when a page drops, plus real-visitor monitoring.
We did all of this on agilitycms.com, a Next.js site on Agility. On launch day it scored 39 on mobile, and three days later 85–98. The numbers below are from that work.
Measure first, and measure the right thing
A wrong measurement sends you after the wrong fix. Before changing anything:
- Measure production, or a production build on production hosting. Never a development server.
- Don't judge a score on a deploy preview. Hosts inject their own toolbars into previews (Netlify's added about 2 seconds of LCP to ours), and previews often lack your analytics keys, so they test a different page than visitors get.
- Use the median of three to five runs. On a busy laptop, single runs of the same page ranged from 39 to 99 for us. A CI runner is steadier, but still use the median.
- Warm the cache the way a browser would. Many CDNs keep a separate cached copy for each
Accept-Encoding. A warm-upcurlwithout that header warms a copy Lighthouse never requests:
curl -s -o /dev/null -H "Accept-Encoding: gzip, deflate, br, zstd" https://www.example.com/
- Test with your tags on. If your tag manager loads in production, it has to load in the test.
- Read the trace, not just the score. Open the report's Performance section and look at what fills the main thread before Largest Contentful Paint (LCP). That tells you which of the sections below applies.
1. Third-party scripts: load them after the first interaction
This was our biggest single change. Our tag manager container held about 760 KB of scripts (analytics, ad tags, social pixels, session recorders) and ran all of it during page load. Mobile LCP reached 16 seconds under throttling, and the tags set 19 third-party cookies, which also cost us best practices points.
The fix is to load these scripts after the visitor's first interaction (scroll, tap, click or keypress) instead of at page load.
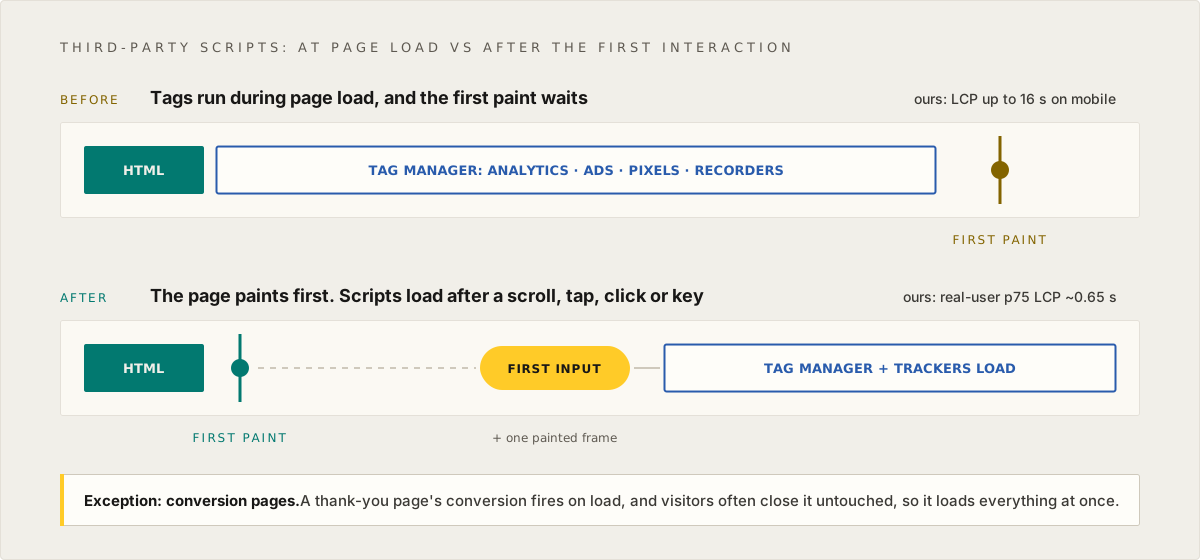
Two details make this work properly:
- Wait for the interaction to paint. If the scripts run inside the first tap, that tap becomes slow and your Interaction to Next Paint (INP) suffers. Run them on the next frame.
- Make the listeners passive, so they never delay scrolling.
// first-interaction.ts: run third-party work after the first interaction has painted
const EVENTS = ["pointerdown", "keydown", "scroll", "touchstart"] as const
const LISTEN = { passive: true, capture: true } as const

let engaged = false
const waiting: Array<() => void> = []

const afterPaint = (cb: () => void) => requestAnimationFrame(() => setTimeout(cb, 0))

function onEngage() {
	if (engaged) return
	engaged = true
	for (const e of EVENTS) window.removeEventListener(e, onEngage, LISTEN)
	afterPaint(() => {
		for (const cb of waiting.splice(0)) cb()
	})
}

if (typeof window !== "undefined") {
	for (const e of EVENTS) window.addEventListener(e, onEngage, LISTEN)
}

/** Call `cb` once, after the visitor's first interaction has painted. */
export function afterFirstInteraction(cb: () => void): void {
	if (typeof window === "undefined") return
	if (engaged) afterPaint(cb)
	else waiting.push(cb)
}
Then load the tag manager (and any other tracker) from it in a client component:
"use client"
import { useEffect } from "react"
import { usePathname } from "next/navigation"
import { afterFirstInteraction } from "@/lib/analytics/first-interaction"

// Pages whose load IS a conversion must not wait: visitors often close them untouched.
const isConversionPage = (path: string) => /^\/thank-you(\/|$)/.test(path)

export function GtmLoader({ gtmId }: { gtmId: string }) {
	const pathname = usePathname()
	useEffect(() => {
		const load = () => {
			if (document.getElementById("gtm-script")) return
			const s = document.createElement("script")
			s.id = "gtm-script"
			s.async = true
			s.src = `https://www.googletagmanager.com/gtm.js?id=${gtmId}`
			document.head.appendChild(s)
		}
		if (isConversionPage(pathname)) load()
		else afterFirstInteraction(load)
	}, [gtmId, pathname])
	return null
}
Before loading the tag manager, set your Consent Mode defaults and the gtm.start dataLayer event, as your consent setup requires.
Know the trade-offs before you ship it
- Conversion pages load at once. A conversion tag that fires on a thank-you page's load can't wait for an interaction that may never come. List every such page.
- Visitors who never interact are invisible to the deferred tools. On a phone almost everyone scrolls, but bounce-only sessions drop out of analytics and ad audiences. If you need those counted, send one lightweight page view with
navigator.sendBeaconwhen the page is hidden, and skip automated browsers (navigator.webdriver, or aHeadlessChrome/Lighthouseuser agent). If you don't, your daily Lighthouse runs will show up as traffic. - Real-user Core Web Vitals lean toward engaged visitors, because the library that measures them loads only after an interaction.
- Yes, Lighthouse stops seeing these scripts entirely, because it never interacts. Confirm the improvement with real-visitor data (see Watch real visitors too), not only with the lab score.
Split the tags inside your tag manager as well
Even after a deferred load, some tags matter more than others. In Google Tag Manager:
- Push a custom event (for example
user_engaged) fromafterFirstInteraction. - Create a Custom Event trigger for it.
- Move tags that only matter once someone engages onto that trigger: session recorders, chat widgets, social pixels, visitor identification, form listeners.
- Leave on page view: analytics, ad conversion and click-attribution tags, which landing and thank-you pages need without an interaction.
Write down each tag's original trigger before you change it. That list is your rollback if a marketing report breaks.
2. JavaScript: set a budget and enforce it in CI
- Pick a per-route budget for first-load JavaScript, and fail the build when a page exceeds it. Ours is 200 KB gzipped (React and the Next.js runtime alone are about 147 KB), plus a rule that no pull request may grow a route by more than 5 KB.
- Lazy-load interactive components from a client module. In the App Router,
next/dynamicinside a Server Component doesn't split the bundle. Put thedynamic()call in a"use client"file and import the component from there, so its code loads only on pages that render it. - Replace JavaScript with HTML where you can. An FAQ accordion built on
<details>/<summary>ships no JavaScript, and every answer stays in the HTML for crawlers. - Use a click-to-load facade for video. A YouTube embed loads about 700 KB of player code even if nobody presses play. Show a poster and a play button, and swap in the iframe on click.
3. Images: size them to the space they fill
- Give every image a
srcsetandsizesthat match the width it's drawn at. Withoutsizes, a phone at 2× density will pick a desktop-sized file. - Never ask for a width wider than the original. The Agility image CDN upscales:
?w=4000on a 940 px image returns a 4,000 px file. Cap eachsrcsetwidth at the asset's native width. - Add
format=autoso browsers get AVIF or WebP. Don't add size parameters to SVGs. - Give the one LCP image
fetchpriority="high"and noloading="lazy". Lazy-load the rest. - Set
widthandheight(or an aspect ratio) on every image, so nothing shifts as images load.
See Image Transformation Reference and Image Best Practices.
4. Rendering and caching: serve cached HTML
- Keep pages static. If a page reads
searchParams, cookies or headers on the server, Next.js renders it on every request. Our listing pages did that for paging and filters, and the result was a layout shift of 0.88 while the content streamed in. Fold the filter values into the path in your proxy, so each filtered view is just another cacheable page. - Use a long CDN lifetime, and purge on publish. A cache miss runs your server function, which can take seconds. We moved from a 60-second CDN lifetime to 24 hours. Agility's publish webhook purges by cache tag, so editors still see their changes within seconds. See Rendering & Data Fetching with Next.js.
- Pre-render your most-visited pages at build time, not just your top-level pages. A popular blog post shouldn't wait for an on-demand render on its first visit after a deploy.
Set up a daily Lighthouse check
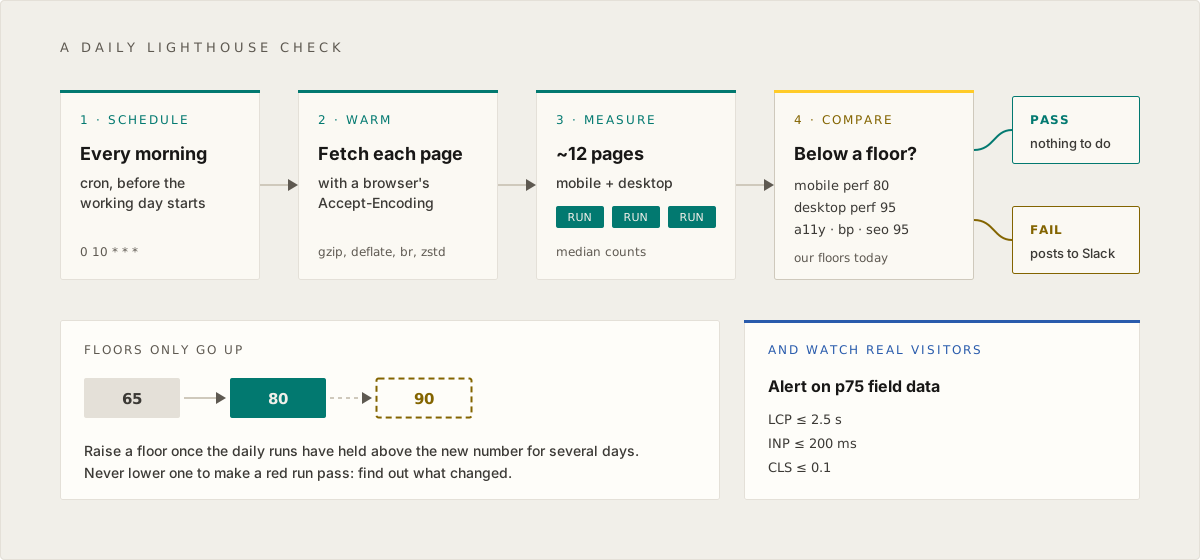
Scores drift after launch. Someone adds a tag, a component ships, an editor uploads a 4 MB hero image. A scheduled run against the live site catches it the next morning.
Choose the pages
Pick about a dozen pages: your most-visited pages from analytics, plus one page of each template (home, a listing, a detail page, a form page, a landing page). Each page costs six Lighthouse runs a day (three mobile, three desktop), so keep the list short. Re-pick it a month after launch, from real traffic.
Set floors, not targets
Set a minimum score per category, just under what your pages score today. Then raise it:
- Raise a floor only after the daily runs have held above the new number for several days.
- Never lower a floor to make a red run pass. Find out what changed.
- Lighthouse turns a score green at 90, so that's a good long-term floor. Our accessibility, best practices and SEO floors are 95. Mobile performance started at 65, is at 80, and is heading for 90.
The workflow
This example uses Lighthouse CI on GitHub Actions. We use our own small script instead, but the behaviour is the same: three runs per page, the median counts, and the job fails if any category falls below its floor.
lighthouserc.mobile.json:
{
	"ci": {
		"collect": {
			"url": [
				"https://www.example.com/",
				"https://www.example.com/blog",
				"https://www.example.com/blog/a-popular-post",
				"https://www.example.com/pricing",
				"https://www.example.com/contact"
			],
			"numberOfRuns": 3
		},
		"assert": {
			"assertions": {
				"categories:performance": ["error", { "minScore": 0.8, "aggregationMethod": "median" }],
				"categories:accessibility": ["error", { "minScore": 0.95, "aggregationMethod": "median" }],
				"categories:best-practices": ["error", { "minScore": 0.95, "aggregationMethod": "median" }],
				"categories:seo": ["error", { "minScore": 0.95, "aggregationMethod": "median" }]
			}
		},
		"upload": { "target": "filesystem", "outputDir": "./lighthouse-results/mobile" }
	}
}
For lighthouserc.desktop.json, copy it, add "settings": { "preset": "desktop" } under collect, raise the performance floor (ours is 0.95), and change the outputDir.
.github/workflows/lighthouse.yml:
name: Lighthouse

on:
  schedule:
    - cron: "0 10 * * *" # 10:00 UTC daily: 5 a.m. EST, 6 a.m. EDT
  workflow_dispatch:

jobs:
  lighthouse:
    runs-on: ubuntu-latest
    strategy:
      fail-fast: false
      matrix:
        form_factor: [mobile, desktop]
    steps:
      - uses: actions/checkout@v5

      - uses: actions/setup-node@v5
        with:
          node-version: 24

      - name: Warm the CDN cache with a browser's Accept-Encoding
        run: |
          for url in $(jq -r '.ci.collect.url[]' lighthouserc.${{ matrix.form_factor }}.json); do
            curl -s -o /dev/null -H "Accept-Encoding: gzip, deflate, br, zstd" "$url"
          done

      # Pin the version: a new Lighthouse release can move scores on its own.
      - name: Run Lighthouse
        run: npx @lhci/cli@0.14.0 autorun --config=lighthouserc.${{ matrix.form_factor }}.json

      - name: Keep the reports
        if: always()
        uses: actions/upload-artifact@v4
        with:
          name: lighthouse-${{ matrix.form_factor }}
          path: lighthouse-results/
          retention-days: 30

      - name: Tell Slack
        if: failure() && github.event_name == 'schedule'
        env:
          SLACK_WEBHOOK_URL: ${{ secrets.SLACK_WEBHOOK_URL }}
          RUN_URL: ${{ github.server_url }}/${{ github.repository }}/actions/runs/${{ github.run_id }}
        run: |
          curl -s -X POST -H "Content-Type: application/json" \
            --data "{\"text\":\"Lighthouse (${{ matrix.form_factor }}) dropped below a floor: $RUN_URL\"}" \
            "$SLACK_WEBHOOK_URL"
Check npm for the current @lhci/cli version and pin that. Use a Slack incoming webhook URL stored as a repository secret.
If you test a host other than production
If a staging or preview host sends noindex (it should; see the Website Deployment Checklist), Lighthouse's is-crawlable audit fails there and costs about 40 SEO points. Turn that audit off for non-production runs, for example with "assertions": { "is-crawlable": "off" } and "settings": { "skipAudits": ["is-crawlable"] }.
A known lab-only stall: RenderDocument
If a page's trace shows the main thread idle and the page ready to paint, yet First Contentful Paint arrives one to two seconds after DOMContentLoaded, you may be seeing a Chrome issue rather than a problem with your site.
The tool Lighthouse uses to launch Chrome turns off a feature called RenderDocument, and with it off, Chrome can throttle a page's first frame to once per second (crbug 575939921, Lighthouse #17148). The Chrome your visitors run has the feature on, so they never see the stall. In a side-by-side test on our home page, turning it back on moved the median mobile score from 85 to 95.5.
To turn it back on, pass Chrome flags that repeat the launcher's disabled-features list without RenderDocument. Chrome keeps the last --disable-features flag it receives. This list matches Lighthouse 13.5.0, so check it against your version:
"settings": {
	"chromeFlags": "--headless=new --no-sandbox --disable-features=Translate,OptimizationHints,MediaRouter,DialMediaRouteProvider,CalculateNativeWinOcclusion,InterestFeedContentSuggestions,CertificateTransparencyComponentUpdater,AutofillServerCommunication,PrivacySandboxSettings4 --enable-features=RenderDocument"
}
Remove the override once your runner's Chrome includes the upstream fix. PageSpeed Insights will show the stall until Google's own Chrome is updated, so don't use it to judge a page with this trace.
Watch real visitors too
A lab score tells you about regressions before visitors feel them. Field data tells you whether they did. Collect Core Web Vitals from real browsers with your analytics tool (PostHog, Google Analytics and most RUM tools can capture them), and set an alert on the 75th percentile:
| Metric | Good, at p75 |
|---|---|
| Largest Contentful Paint (LCP) | ≤ 2.5 s |
| Interaction to Next Paint (INP) | ≤ 200 ms |
| Cumulative Layout Shift (CLS) | ≤ 0.1 |
We alert when mobile p75 LCP goes above 2.5 seconds. It's around 650 ms today.
Checklist
- Measure production, with tags on, using the median of several runs.
- Load third-party scripts after the first interaction, except on conversion pages.
- Split tag-manager tags between page load and first engagement.
- Enforce a first-load JavaScript budget in CI.
- Give images
srcsetandsizes, capped at native width, withformat=auto. - Keep pages static, with long CDN lifetimes and a purge on publish.
- Run Lighthouse daily on your top pages, with a floor for each category and an alert when one fails.
- Raise floors as the daily runs hold. Never lower one to pass.
- Alert on real-visitor Core Web Vitals.
Want help working out what's holding a page back? Our concierge team can review a Lighthouse report with you: use the chat button on any docs page, or email support@agilitycms.com.
On this page